| Home | Teachers | | | Mentors | | | Discussions | | | Research | | | Find |
| Out, darn spot! | Guided Research: Data Analysis |
|
|

Guided Research What do want to learn What we already know What we're going to do Share our data See others' data Picturing the data What does data mean? More questions What do we do now? Student Research Publish View
|
Making Sense of the Data 
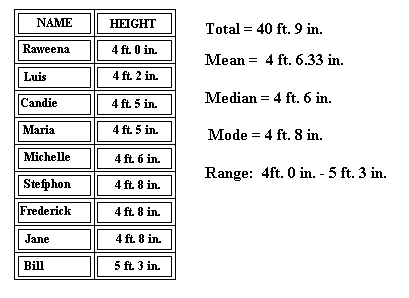
Right now, your data is in the form of a table. It is important that you know the parts of the table for our discussion later.  Although the table you selected shows you everything you
asked for, it may not be easy to understand what the data is telling you.
To better understand what the data is telling you, you need to organize
it. When we organize the data, it is easier for us to see...
There are three ways in which you can organize the data
to make it easier to understand:
You will usually use all three to understand the data before developing a conclusion. The best way to start is to rearrange the data in your
table. When you rearrange data, you organize it so that certain types
of data are grouped together. You focus on one type of data and rearrange
the table so that all of the data of that kind are together.
Some people say that category of data you choose to rearrange
the data by is called MAKING THAT CATEGORY CONSTANT.
You can choose any data category and rearrange the data
entries according to it.
Organizing the data so that we can answer our research
question will be complicated.
This is the first step in a three-step process in making sense out of our data for our research question. Now that all of the data has been sorted by solvent, you
want to look at the data entries and look for any major differences.
If the comments section does not make it clear, you may want to e-mail each school and see if they can give you an idea of why the answers are so different. Depending on the reasons, you may choose to ignore some data entries. However if you decide to ignore some data entries, you'll need to explain in your conclusion why you chose to ignore them. Another way of making the data easier to understand is to use measures of statistics To help us answer our research question, we need to find the average of stain and color loss scores for each solvent/method combination. Look at all of the entries for one solvent/method combination. Let’s use Alcohol/Brushing as an example.
Do the same for the Shirt Color Loss Score—Mustard, Kool-Aid Stain Score, Shirt Color Loss Score—Kool-Aid.
We need to find a way to record these averages. The easiest way to do this is to add 4 new columns for averages to the table--one after each score column.
Then do the same for each solvent/method combination.
Something to keep in mind: when we are working with averages, the more data entries you have averaged the more realistic your results are. Let's say you have 10 entries for White Vinegar/Flushing combination and an average shirt color loss--Kool-Aid Score of 4. You also have only 1 entry for Bleach/Brushing combination with a Shirt Color Loss--Kool-Aid Score of 5. Which one do you think is more realistic? The White Vinegar/Flushing is more realistic because it's been supported by more tests. You need to keep this in mind when looking at the data especially when you use measures of statistics. Now that you have averaged each of the combinations, you need to sort the data entries again. This time you want to focus on the four scores (Mustard, Shirt Color Loss--Mustard, Kool-Aid, Shirt Color Loss--Kool-Aid). You want to arrange them so that the combinations with the highest averages are at the top:  Notice that we have not included making graphs for this project. Many people feel that graphs help make a clearer picture of the data. You're invited to make a graph on your own. General help in making graphs is available. Ideally at this point, you should have the answer to the research question. The solvent/method combination that has the highest average score for all four scores should be the one of choice. However, a good researcher looks at the data carefully before jumping to a conclusion. As a good researcher, you want to start asking questions like: Were enough tests performed for each combination? Is there a difference between the results you obtained when you used a solvent/method combination and washed it and when you just washed it without pretreating it? Are there tests where the results are so different that you wonder about variables that may have not been mentioned? Are there variables that you have not thought about? A good researcher will go back and conduct more tests clear up any confusion or answer any questions. Once you have made sense of the data, it is time for you to explain: "What does the data mean?"
 |
| 1999, KanCRN Collaborative Research Network |